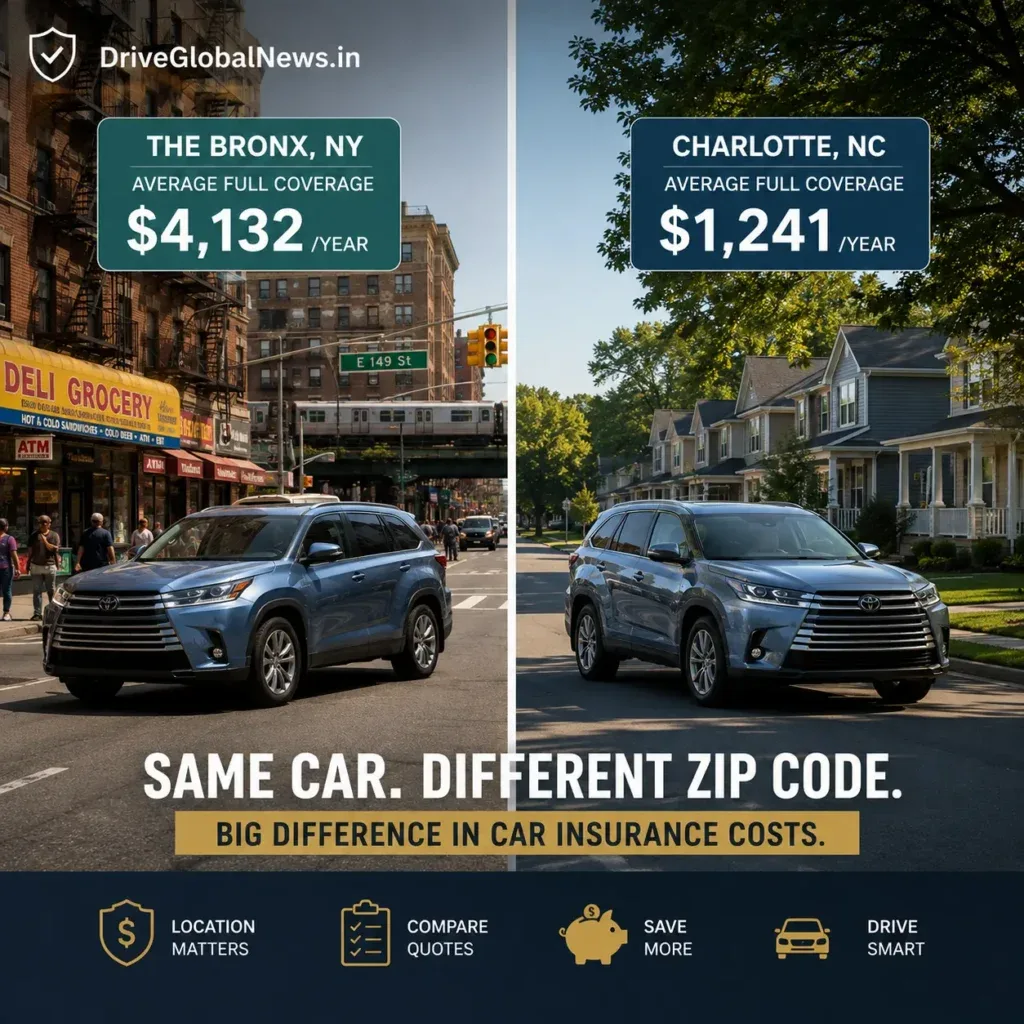
Same car. Same age. Same driving record. Zero accidents. Zero tickets.
One driver pays $69 per month for car insurance.
Another driver pays $522 per month for the exact same coverage.
The difference between them isn’t anything they did. It isn’t their credit score. It isn’t their vehicle. It isn’t how carefully they drive.
It’s their ZIP code.
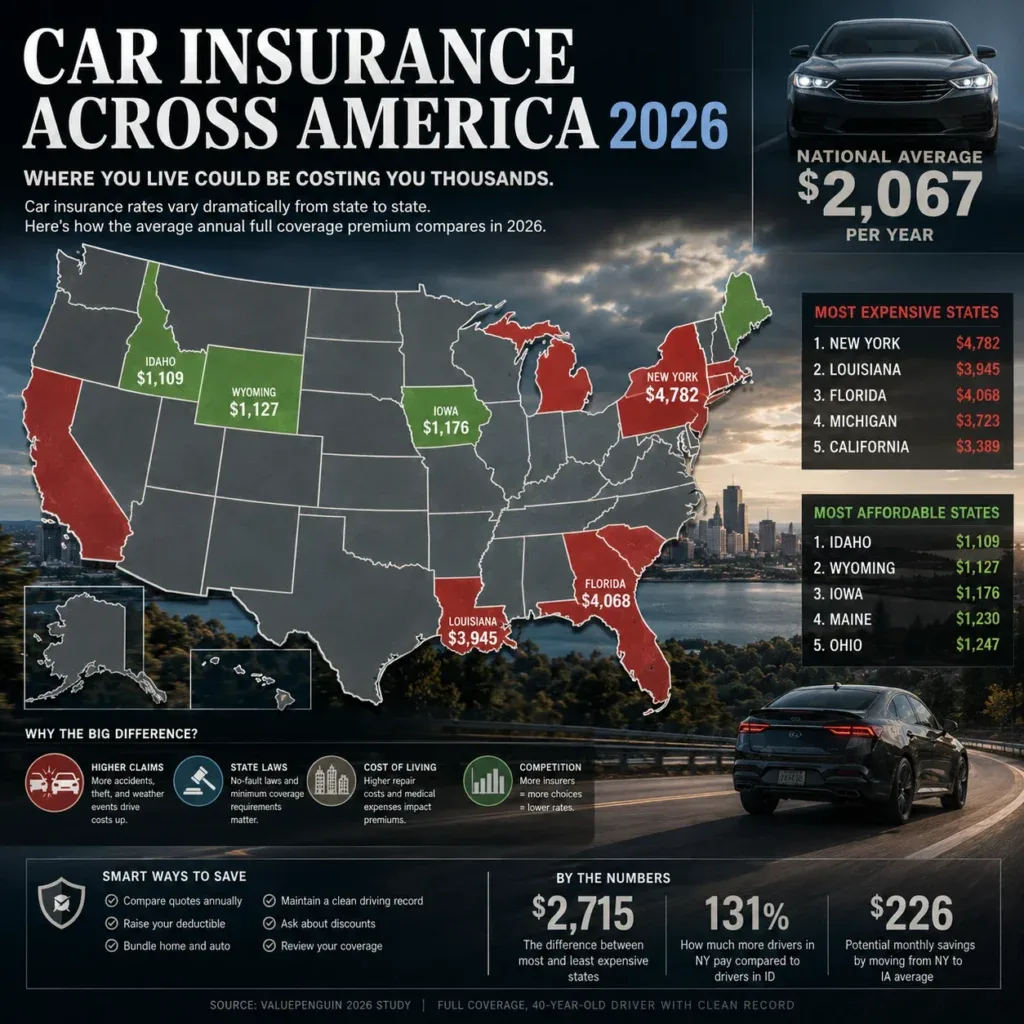
Insurify updated its state-by-state car insurance data this week — and the numbers reveal something that most Americans instinctively understand but rarely see quantified this starkly. Where you live determines your car insurance bill more than almost any other single factor. And the gap between the cheapest and most expensive locations in America isn’t a rounding error. It’s a $5,442 per year difference between the best and worst places to insure a car.
Here’s what the data actually shows — and what it means if you live somewhere on the wrong end of that gap.
The Most Extreme Numbers in America
Let’s start with the specific numbers that define the outer boundaries of this problem.
The most expensive place to insure a car in America: The Bronx, New York. Average full-coverage car insurance: $6,270 per year. That’s $522.50 per month. For a neighborhood in New York City.
The cheapest state for liability coverage: North Carolina, at an average of $69 per month — $828 per year.
The gap between those two: $5,442 per year. For a driver who has done nothing differently except choose where to live.
Even comparing at the state level — where the Bronx extreme gets averaged with quieter upstate New York — the gap is enormous. Connecticut averages $161 per month for liability coverage — the most expensive state for liability. North Carolina at $69 per month is the cheapest. A $92 monthly difference — $1,104 per year — between two states’ average liability rates.
For full coverage, the gap is even wider. Washington D.C. averages $4,088 per year — the highest in the country. Vermont averages around $1,176 per year. $2,912 per year difference between two American places for the same coverage.
Why the Same Car Costs Five Times More to Insure in Some Cities
The insurance industry doesn’t set prices based on what’s fair. It sets prices based on what’s mathematically accurate.
Three factors explain virtually every expensive insurance market in America.
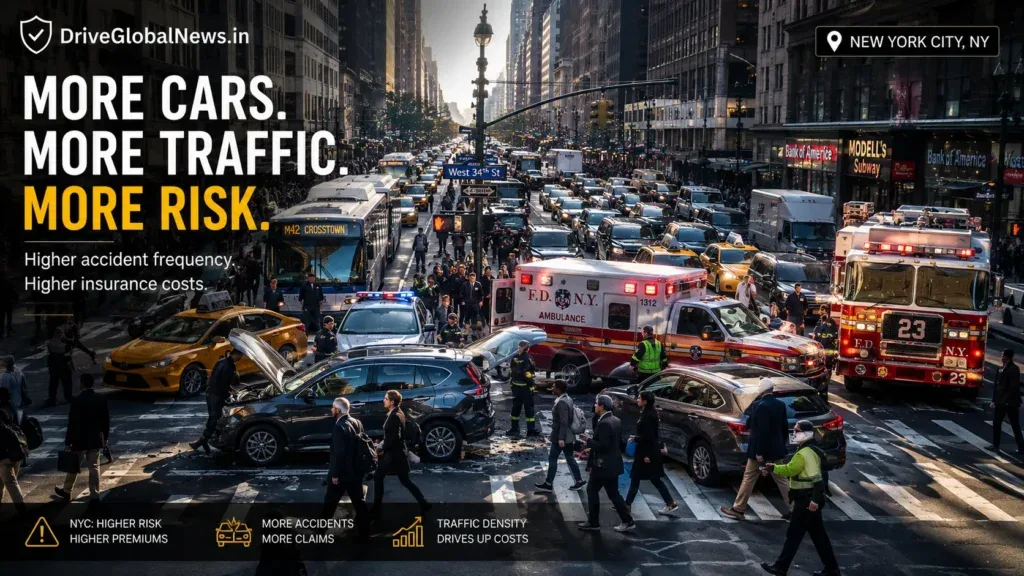
Accident frequency. The Bronx has dense traffic, aggressive driving conditions, complex intersections, and a pedestrian environment where vehicle-pedestrian accidents occur more frequently than in rural or suburban settings. More accidents mean more claims. More claims mean higher premiums for everyone in the territory — including the careful driver who has never caused one.
Uninsured driver rates. Florida’s average rate for car insurance is $311 per month partly because approximately 20% of Florida drivers carry no insurance. When an uninsured driver causes an accident, the insured driver’s own uninsured motorist coverage pays. The cost of covering uninsured drivers gets distributed across all policyholders in the state. High uninsured driver populations directly increase premiums for everyone around them.
Litigation costs. New Jersey jumped from the 15th most expensive state in 2024 to the 6th most expensive in 2025 partly because of legal environment factors — jury verdicts in personal injury cases, medical payment requirements, and minimum coverage increases that took effect in 2026. When lawsuits after accidents produce larger settlements, insurers pay more per claim. Those costs are reflected in every premium in the state.
Repair costs. Urban markets with high wages and limited independent repair shops produce higher labor rates per claim. A fender bender in a Manhattan body shop costs dramatically more to repair than the same damage in a rural Tennessee shop. Those cost differences flow directly into premiums.
The States Getting Better — And the Ones Getting Worse
Insurify’s August 2026 data reveals a clear split in which direction different states are moving.
States where rates dropped significantly:
Wyoming saw a 30% decrease in full-coverage rates through 2025 — the largest drop of any state in recent memory. Wide roads. Low traffic. Minimal litigation. Wyoming’s accident environment is genuinely low-risk and rates now reflect that accurately.
Iowa is projected to see a 6.19% decrease in 2026 — the largest projected decline of any state this year. Arkansas and several other Midwest and Mountain West states also saw rates drop over 20% in 2025.
States where rates are still climbing:
New Jersey is the clearest example of a state going in the wrong direction. Average full-coverage: $2,978 per year. New minimum coverage requirements that took effect in 2026 — including higher minimums for uninsured and underinsured motorist coverage — pushed rates higher on top of existing increases. New Jersey went from 15th most expensive in 2024 to 6th most expensive in 2025. The trajectory hasn’t reversed.
Washington D.C.’s rate hit $4,088 after an 18% surge last year. Michigan jumped to the 4th most expensive state after a 12% increase.
What You Can Actually Do If You Live Somewhere Expensive
This is the part where most articles offer advice that sounds useful but isn’t.
“Consider moving to a cheaper state” is technically accurate and practically irrelevant. People don’t uproot their lives to lower their car insurance bill.
The advice that’s actually useful for expensive-market drivers:
Shop aggressively and repeatedly. The variation between insurers within an expensive market is larger than the variation in cheaper markets. A Bronx driver who gets quotes from five insurers might find rates ranging from $400 per month to $650 per month for identical coverage. The higher quote isn’t better coverage. It’s just more money. The Insurify database covers over 500 insurance companies — and in expensive markets, the spread between their rates is widest.
Consider usage-based insurance if you drive infrequently. In dense urban markets where many residents don’t drive daily — or drive relatively few miles annually — pay-per-mile insurance can produce significant savings. Metromile and similar programs charge a base rate plus a per-mile fee. A Bronx resident who drives 5,000 miles per year might save $1,500-$2,000 annually versus a standard policy priced for average-mileage drivers.
Maximize every available discount. In expensive markets, discounts matter more because the base rate is higher. A 20% telematics discount is $100 per month on a $500 premium versus $40 per month on a $200 premium. The same percentage discount produces dramatically more savings when applied to a high base rate. Every discount — defensive driving courses, bundling, autopay, paperless billing — is worth claiming specifically because the starting number is so large.
Verify your coverage levels match your vehicle value. A driver in the Bronx with a 2016 Honda Civic worth $9,000 paying $6,270 per year for full coverage is paying 70% of the car’s value annually in insurance. At that ratio, dropping to liability-only and self-insuring collision makes mathematical sense — if the loan is paid off. The 10% rule applies everywhere, but it’s most consequential in expensive markets where the full-coverage premium is highest.
The Bottom Line
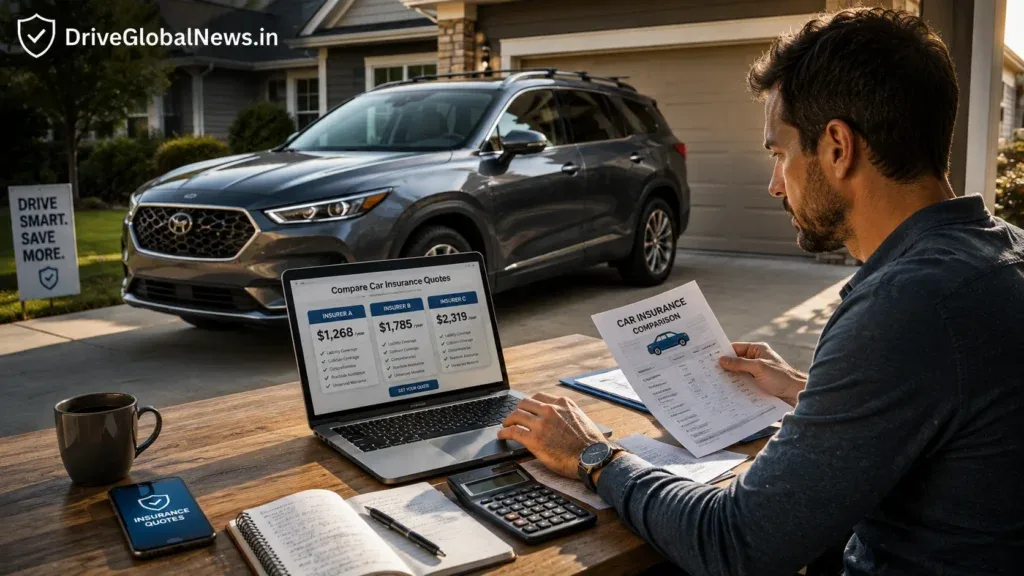
Car insurance is the financial bill most Americans pay every month without fully understanding why it costs what it costs.
The ZIP code answer is uncomfortable because it implies you’re being punished for something you didn’t do. You didn’t cause the accidents in the Bronx that push everyone’s rates toward $6,000 per year. You didn’t create Florida’s uninsured driver problem. You didn’t set New Jersey’s minimum coverage requirements.
But your premium is calculated on the environment you share with everyone else in your territory — not just on your own record.
That’s the system. The drivers who minimize its impact are the ones who shop aggressively, use telematics when it benefits them, and verify their coverage matches their actual vehicle value. The ones who don’t are paying whatever their insurer decided to charge — and in expensive markets, that number is very high.